How to Read Crypto Charts for Beginners:
What Are Crypto Charts, Really?
At their core, crypto charts are just visual representations of price movements. Think of them like the health monitor of a cryptocurrency—they show you how it’s doing over time.
They answer questions like:
- Is the price going up or down?
- Are people buying more or selling more?
- How volatile is the market right now?
Reading these charts helps traders make smarter decisions: when to buy, when to sell, and when to hold on tight.
Let’s say you’re checking the weather forecast. If the temperature was 75°F yesterday, 80°F today, and expected to hit 85°F tomorrow, you’d probably think summer’s heating up, right? Crypto charts work the same way. They give you a “forecast” of market behavior by showing how prices have changed and might change again. You’re basically becoming a crypto meteorologist—but instead of rain clouds, you’re spotting bullish trends.
Why Learning to Read Crypto Charts Is So Important
Imagine trying to navigate a city without a map. Sure, you might eventually get somewhere, but you’ll probably take a bunch of wrong turns along the way. That’s what trading crypto without understanding charts is like.
Here’s why reading crypto charts matters:
- Predict Trends: Charts help you forecast where the price might go next.
- Avoid Bad Trades: Spot potential dips before they become disasters.
- Boost Confidence: Knowledge = power. The more you know, the less emotional your trades will be.
- Develop Strategies: Combine what you see in the charts with your own goals and risk tolerance.
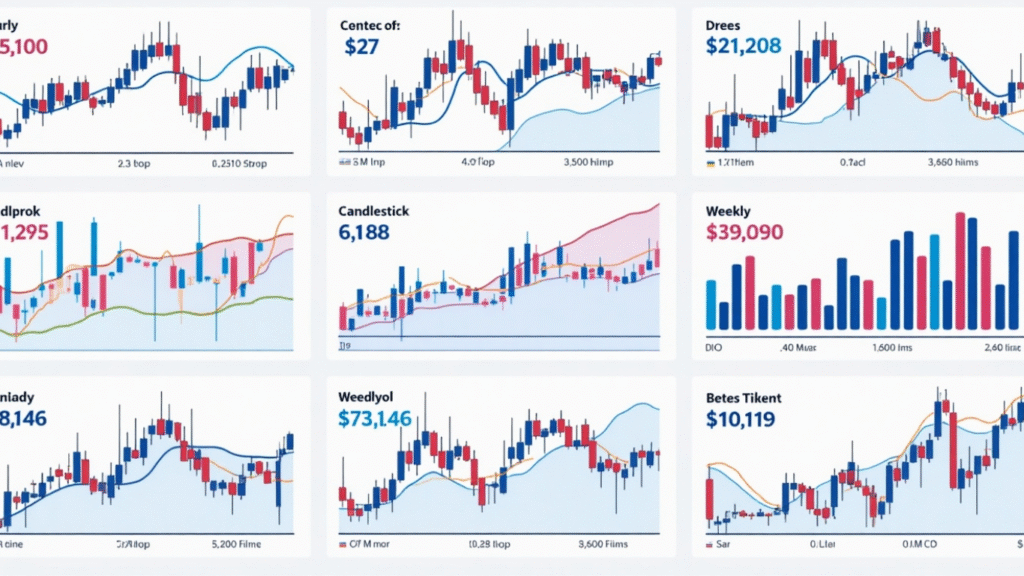
Let’s Talk Chart Types: What Should You Look At?
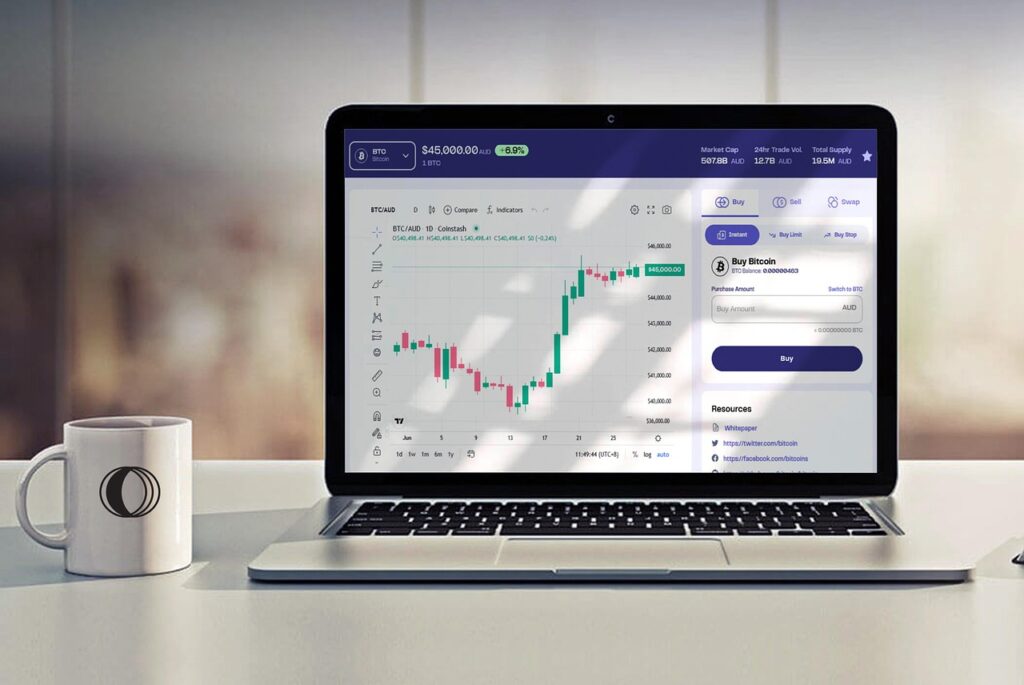
There are several types of charts out there, but let’s focus on the three most common ones you’ll encounter on platforms like TradingView or CoinMarketCap.
1. Line Charts
These are the simplest. A line chart shows a single line tracing the price over time. It connects the closing prices of each time interval, giving you a clear overall direction.
Best for: Beginners who just want to spot general trends.
2. Bar Charts
A bit more complex, bar charts show opening, closing, high, and low prices in a given time frame. Each bar consists of a vertical line with little horizontal ticks showing the open and close.
Best for: Traders who want more detail than a line chart offers.
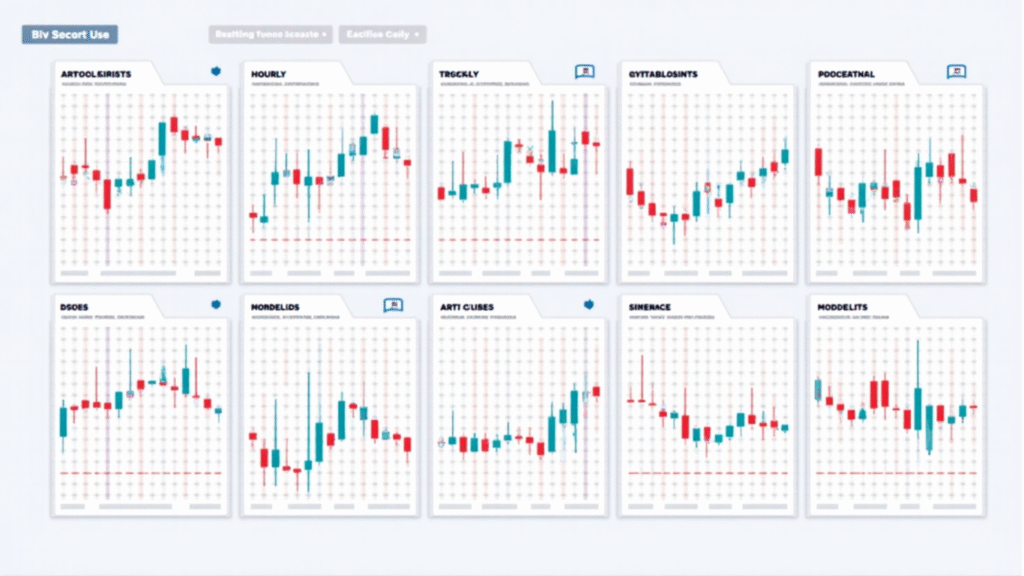
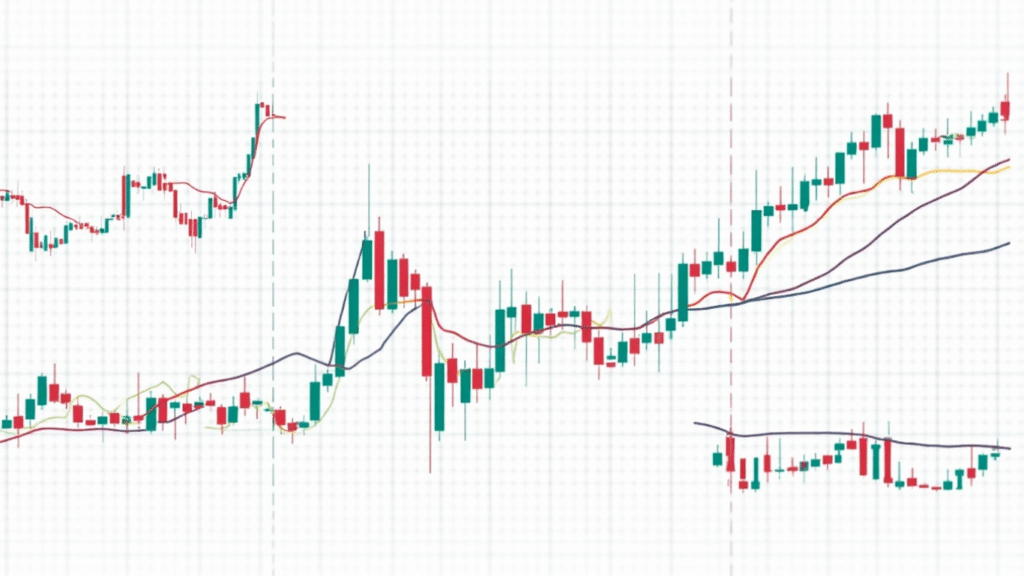
3. Candlestick Charts (The Gold Standard)
This is the most popular chart type among crypto traders. It gives you all the information of a bar chart but in a more visual and intuitive way.
Each candlestick shows:
- Open: Where the price started
- Close: Where the price ended
- High: The highest point during the time interval
- Low: The lowest point
Colors Matter:
- Green/white candles = price went up (bullish)
- Red/black candles = price went down (bearish)
Best for: Pretty much everyone. Candlestick charts balance simplicity and depth.
Timeframes: Choose Your Lens
One of the most misunderstood elements of chart reading is timeframes. Timeframes are simply the duration that each data point on the chart represents.
Common timeframes include:
- 1-minute
- 5-minute
- 1-hour
- 1-day
- 1-week
Shorter Timeframes = More Noise
If you’re day trading, you might focus on 1-minute or 5-minute charts. These are super detailed but also chaotic.
Longer Timeframes = Big Picture
If you’re a long-term investor, you’ll care more about 1-day or 1-week charts. These help you understand long-term trends and avoid short-term panic.
Indicators and Tools That Make Your Life Easier
Now that you’ve got a grip on basic chart types, let’s talk about some helpful indicators that traders use to make sense of the data.
1. Moving Averages (MA)
Think of moving averages like a smoothing tool. They average out past prices to help you see the overall trend without all the daily ups and downs.
- Simple Moving Average (SMA): A straight average of past prices.
- Exponential Moving Average (EMA): Gives more weight to recent prices.
Traders often look at 50-day and 200-day MAs to determine long-term trends.
2. Relative Strength Index (RSI)
The RSI is a momentum indicator that tells you if an asset is overbought or oversold.
- Above 70 = overbought (price might drop)
- Below 30 = oversold (price might rise)
This is super helpful for spotting potential reversals.
3. MACD (Moving Average Convergence Divergence)
The MACD shows the relationship between two moving averages and helps spot momentum changes.
When the MACD line crosses above the signal line? That’s bullish. Crosses below? Bearish.
4. Volume
Volume shows how much of the crypto was traded during a specific timeframe. Higher volume = stronger price movement.
If the price goes up but volume is low, it might not be a strong trend.
Chart Patterns: What Shapes Can Tell You
Believe it or not, certain price patterns repeat themselves—because human behavior tends to repeat. Recognizing these patterns can give you a real edge.
Common Patterns to Know:
Head and Shoulders
- Signals a trend reversal
- Looks like: A high (shoulder), a higher high (head), then a lower high (shoulder)
- Example: Bitcoin climbs to $30K (shoulder), then $35K (head), and drops to $30K again (shoulder). Time to brace for a downturn.
Double Top/Bottom
- Double Top: Indicates a potential drop
- Double Bottom: Signals a potential rise
- Example: Ethereum hits $2,000 twice but can’t break through. That’s a double top watch for a pullback.
Flags and Pennants
- Usually appear after a strong price movement
- Suggest continuation of the trend
- Example: Solana rockets from $15 to $25, then consolidates sideways in a narrow channel a bullish flag forming.
Triangles (Ascending, Descending, Symmetrical)
- Help predict breakout directions
- Example: If a coin forms higher lows against a flat resistance, it’s likely prepping for a breakout.
You don’t need to memorize them all overnight. Start with one or two and expand over time.
Pro Tips for Reading Crypto Charts Like a Boss
- Zoom Out First: Always look at longer timeframes before zooming in. The big picture matters.
- Use Multiple Indicators: Don’t rely on just one tool. Combine moving averages with RSI, MACD, etc.
- Watch Volume: Price means little without volume confirmation.
- Avoid Emotional Trades: The charts help you make data-driven decisions, not emotional ones.
- Backtest Your Strategies: Look at past charts to see how your strategy would have worked.
Common Mistakes Beginners Make (And How to Avoid Them)
Even with the best tools and indicators, beginners often trip up in a few familiar ways. Here’s how to avoid the most common pitfalls:
1. Overanalyzing Every Wiggle
Short-term price action can be noisy. Don’t let a small drop on a 1-minute chart shake your strategy.
2. Ignoring Volume
A price move without volume isn’t trustworthy. Always check the trade volume before reacting.
3. Jumping in Without a Plan
Excited by a bullish signal? Make sure you also set a stop-loss and exit point.
4. Using Too Many Indicators
Stick with two or three core indicators. More isn’t always better—it can just be confusing.
5. Letting Emotions Take Over
Crypto is volatile. Stay calm, stick to your analysis, and never trade based on panic or FOMO.
Advanced Indicators to Explore (Once You’re Comfortable)
Once you’ve mastered the basics, you can level up your charting skills with a few advanced tools. These indicators give even deeper insight into market trends and potential turning points.
1. Bollinger Bands
Bollinger Bands measure volatility and help identify overbought or oversold conditions.
- Upper Band: Price is considered overbought.
- Lower Band: Price is considered oversold.
- Squeeze: When bands are tight together, expect a big move soon.
2. Fibonacci Retracement
Used to identify possible support and resistance levels by dividing a major price swing into key ratios (like 61.8%, 38.2%).
- Traders often use Fibonacci levels to predict where a pullback might stop and reverse.
3. Ichimoku Cloud
A complex yet powerful indicator that provides support/resistance levels, trend direction, and momentum all in one.
- If the price is above the cloud, the trend is bullish.
- If it’s below the cloud, the trend is bearish.
How to Practice Without Risking Real Money
Learning to read charts is one thing—trading based on them is another. Before putting your own money on the line, try these options:
1. Paper Trading
Platforms like TradingView offer paper trading features. You can simulate trades using real market data but without real money.
2. Demo Accounts
Crypto exchanges like Binance and Bybit offer demo accounts where you can trade using virtual funds.
3. Backtesting
This involves looking at historical charts to see how your trading strategy would have performed in the past.
Final.
Reading crypto charts might seem overwhelming at first, but just like learning any new skill, it gets easier the more you practice. The lines, candles, indicators, and patterns that once looked like gibberish will soon start making perfect sense. You’ll begin to see stories unfolding in the charts stories of momentum, emotion, and opportunity.
Remember, becoming a confident chart reader doesn’t happen overnight. It takes curiosity, consistency, and a willingness to learn from both wins and mistakes. But if you’ve made it this far, you’re already ahead of the pack.
So the next time you open a crypto chart, do it with confidence. You’re not guessing you’re reading. And that makes all the difference.
Keep learning, keep practicing, and most importantly trust the process. see